Øresund in Motion
A three-part generative installation turning 25 years of wind, water, and commuter data into flowing visuals that invite a moment of reflection.
This work presents a conceptual proposal for a data-driven installation on the occasion of the Öresund Link's 25-year anniversary. To me, the Link embodies the region's constant state of movement, transition, and interconnection. Through this installation, I aim to capture these qualities in a poetic way and invite the local audience to pause for a moment of reflection.
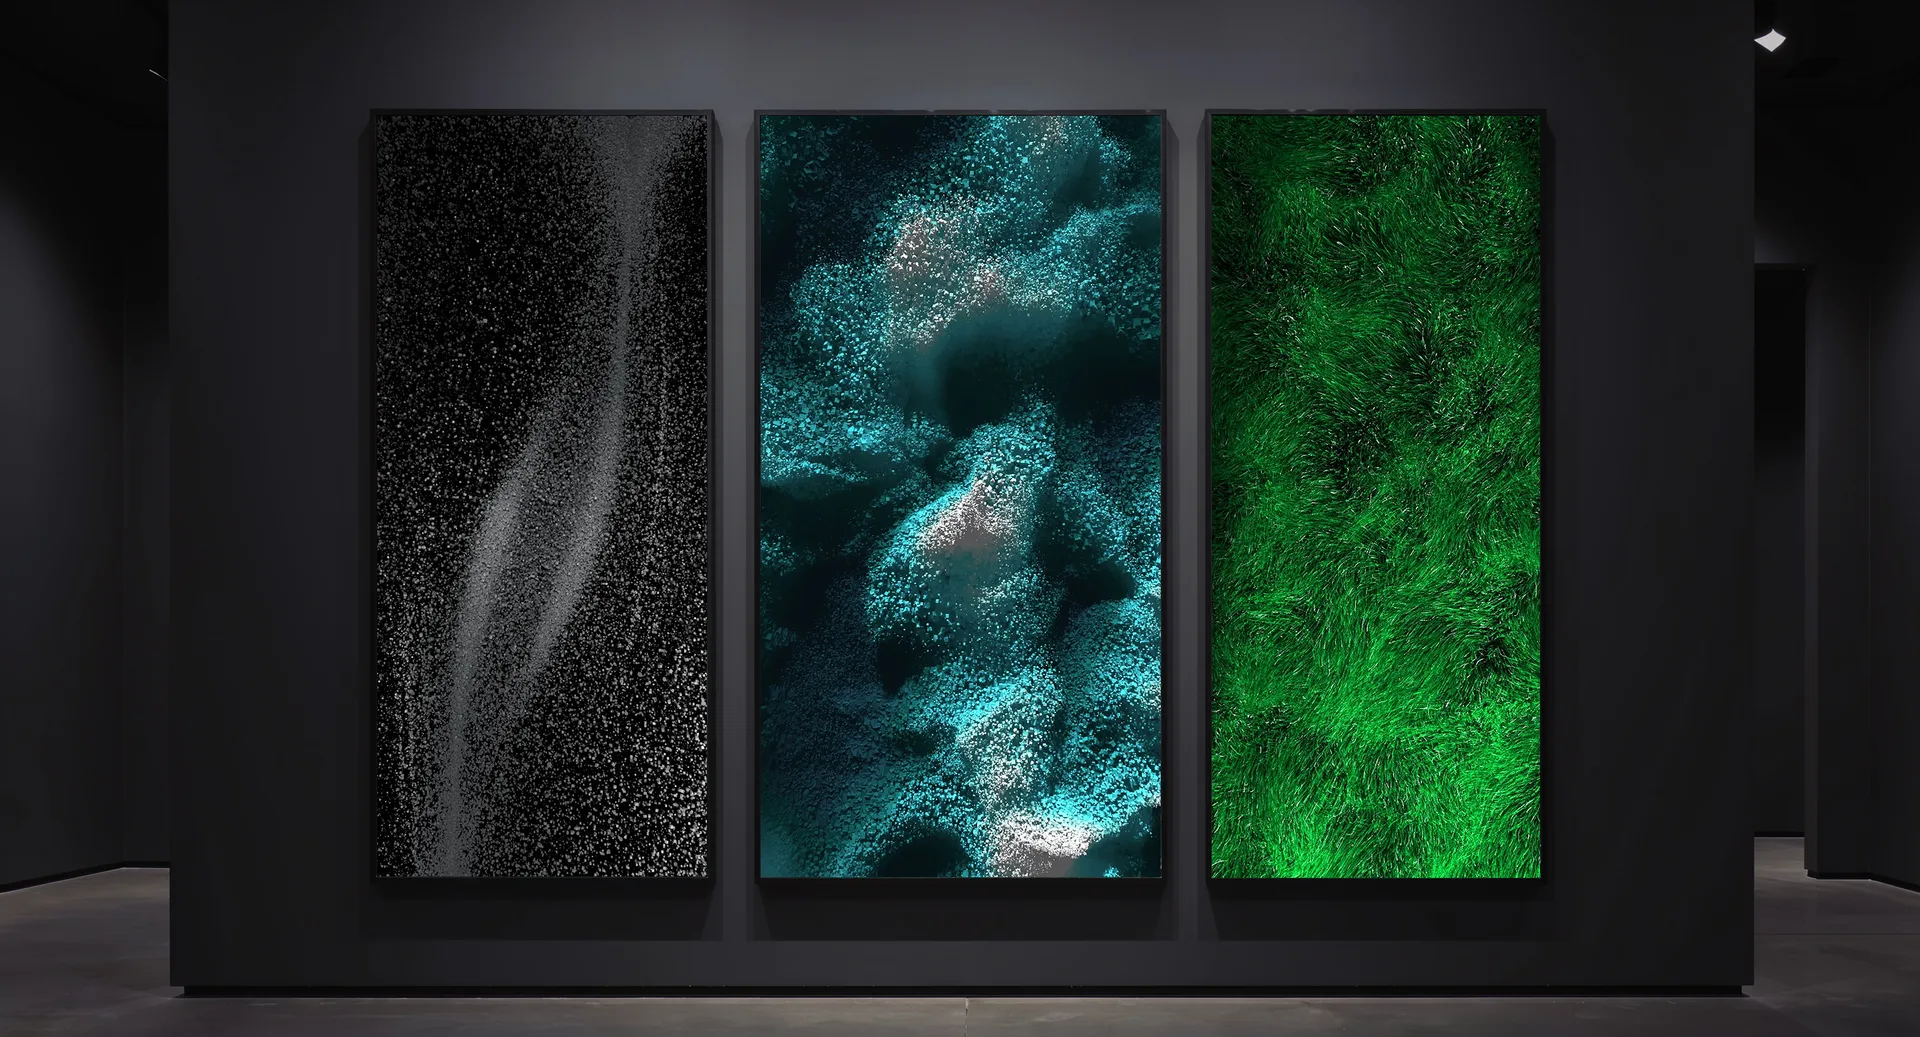
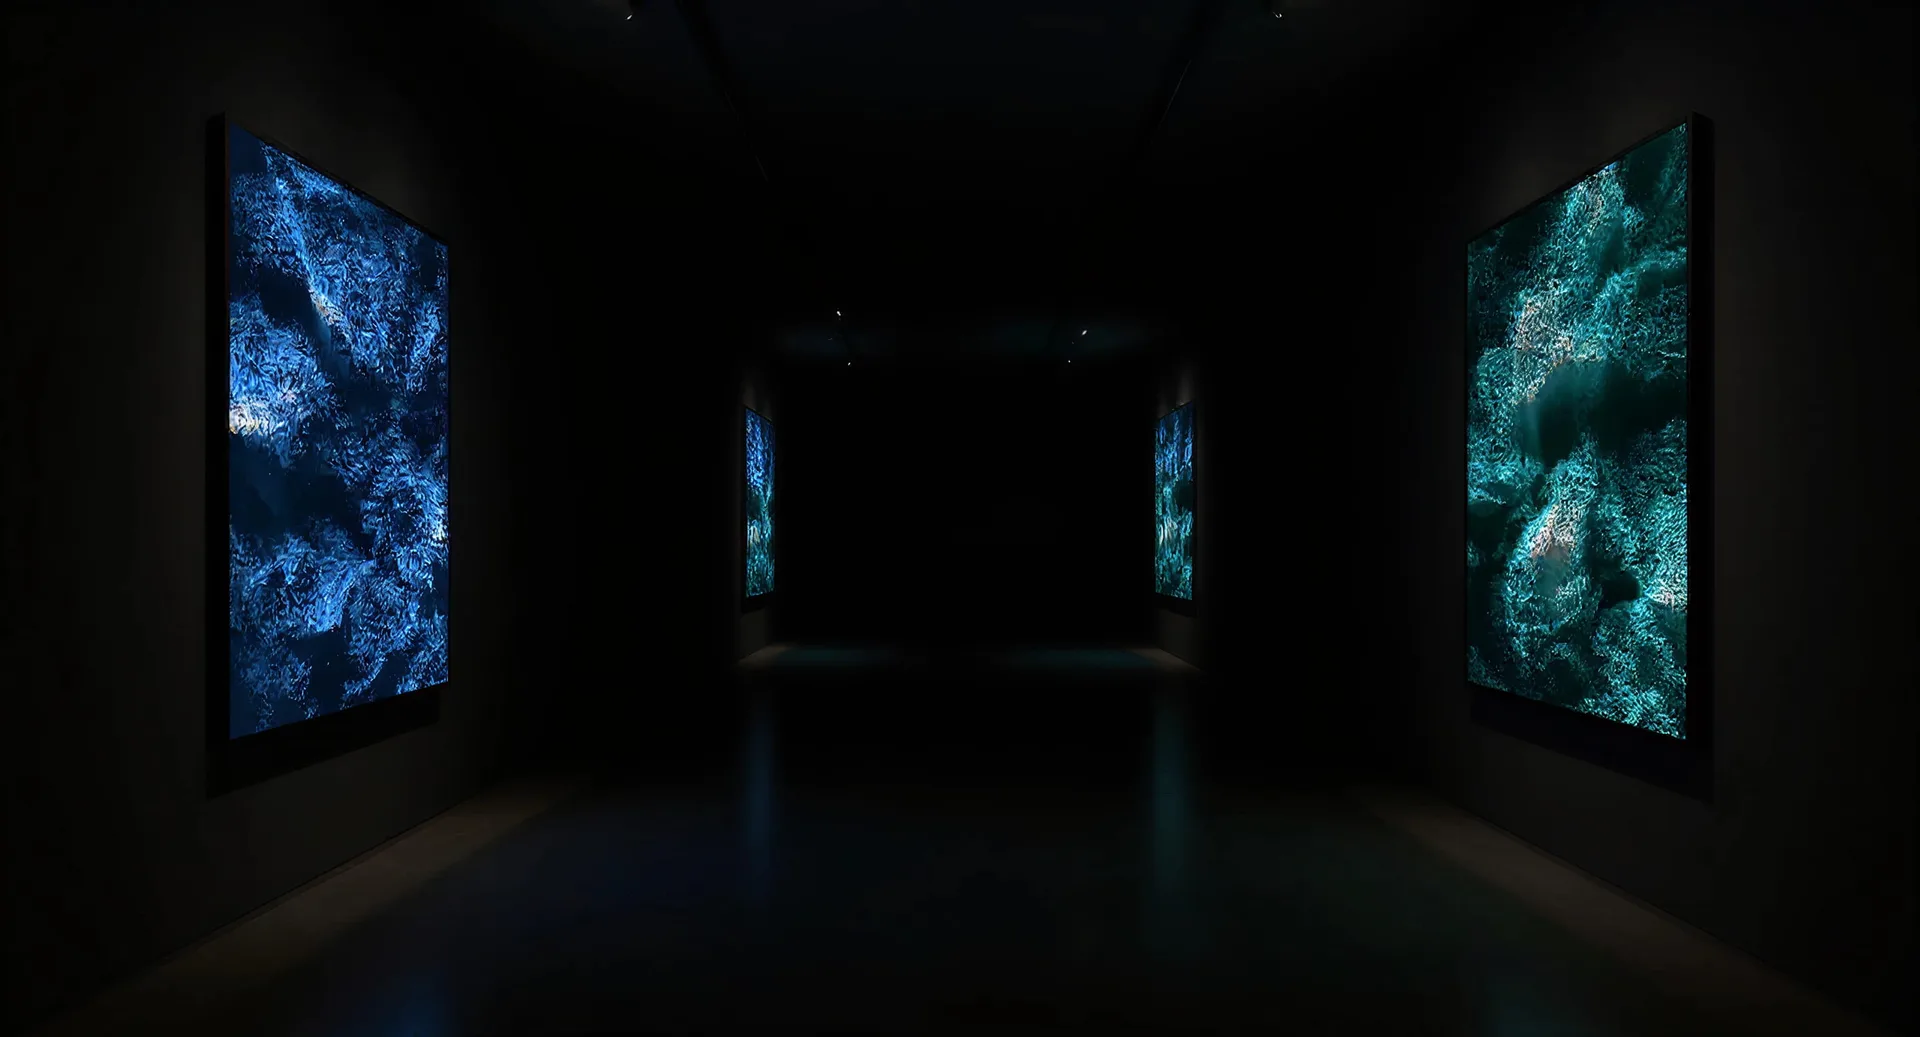
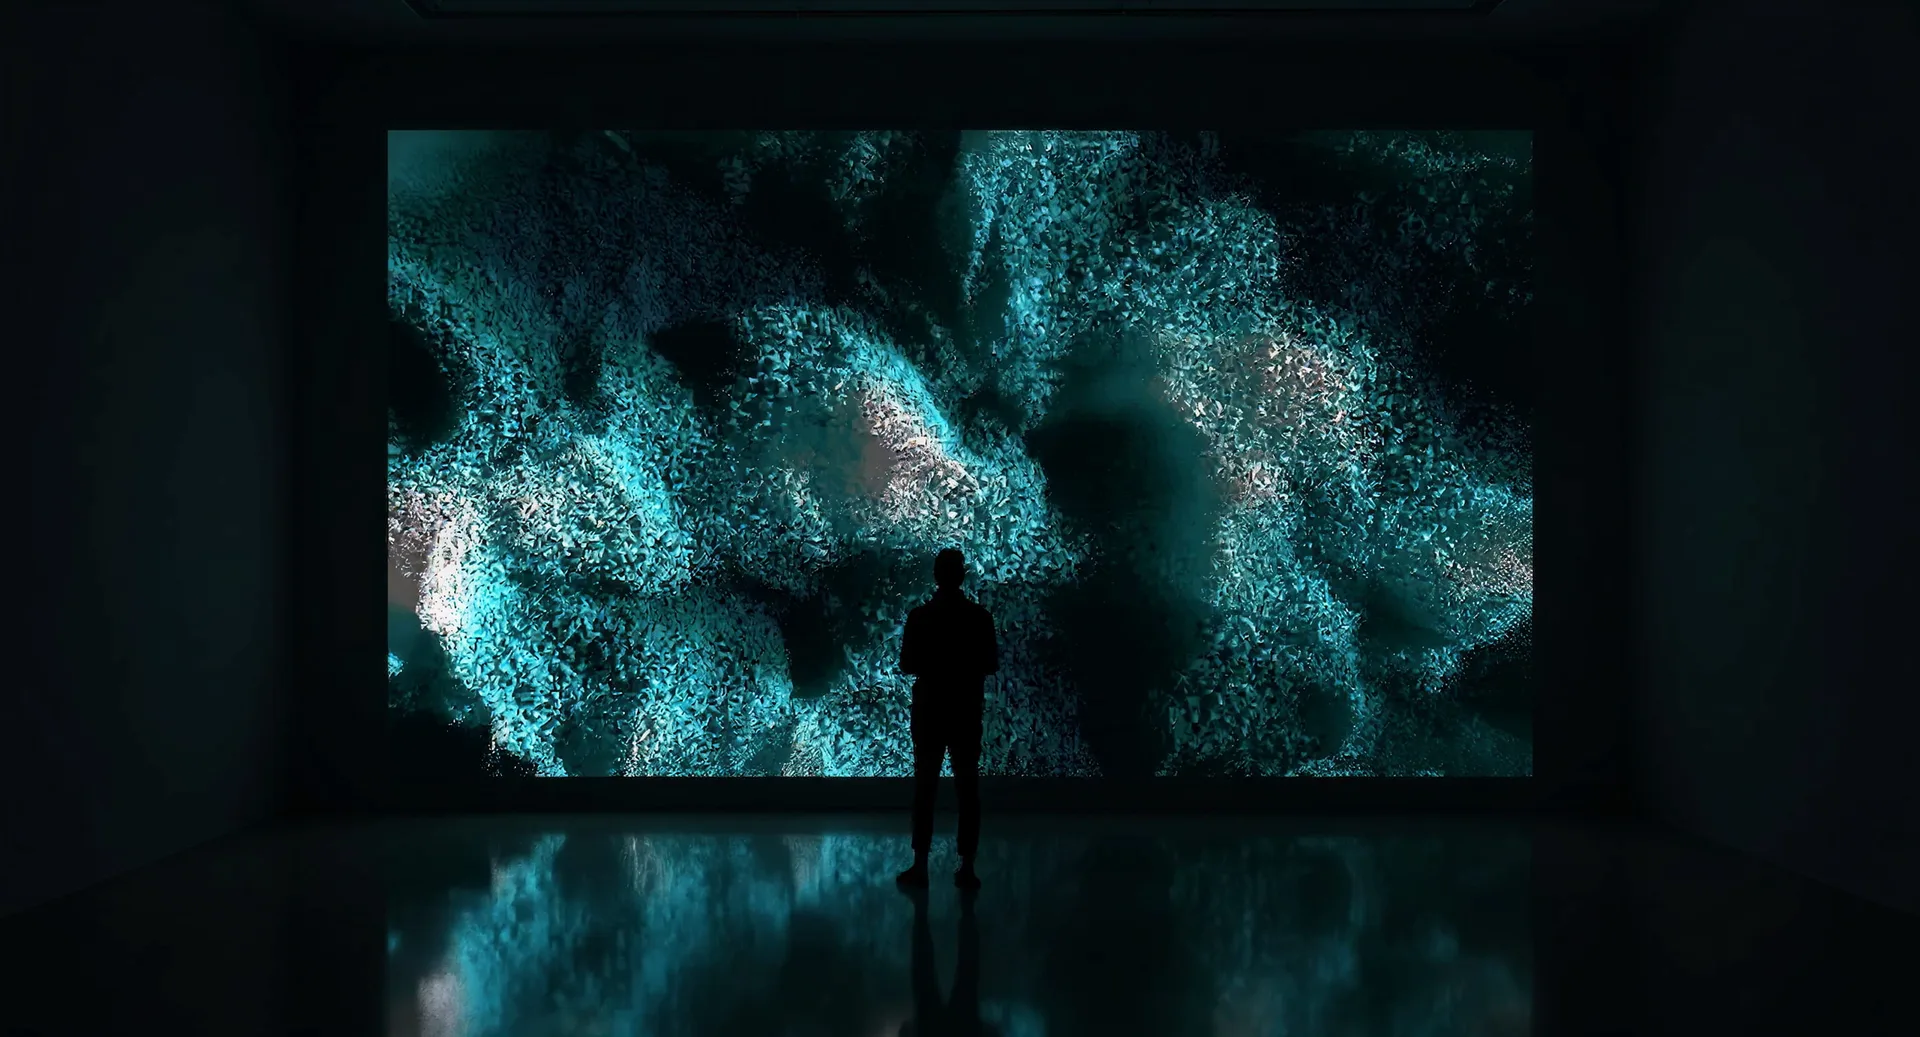
The installation consists of three dynamic generative works created using TouchDesigner. Each offers a unique artistic lens on the ephemeral forces of the Öresund: wind, water, and human mobility. The individual pieces are driven by hourly data collected over the past 25 years. Each cycle lasts approximately 10 min, the time it takes to cross the Link. The installation can be presented in three different configurations: a large-scale projection with all works running in sequence, fostering an immersive spatial experience; a side-by-side setup with all three works running in parallel, highlighting the differences between datasets; or paired presentations of the same work at different points in time, emphasizing changes within each dataset.
Work 1 — Water
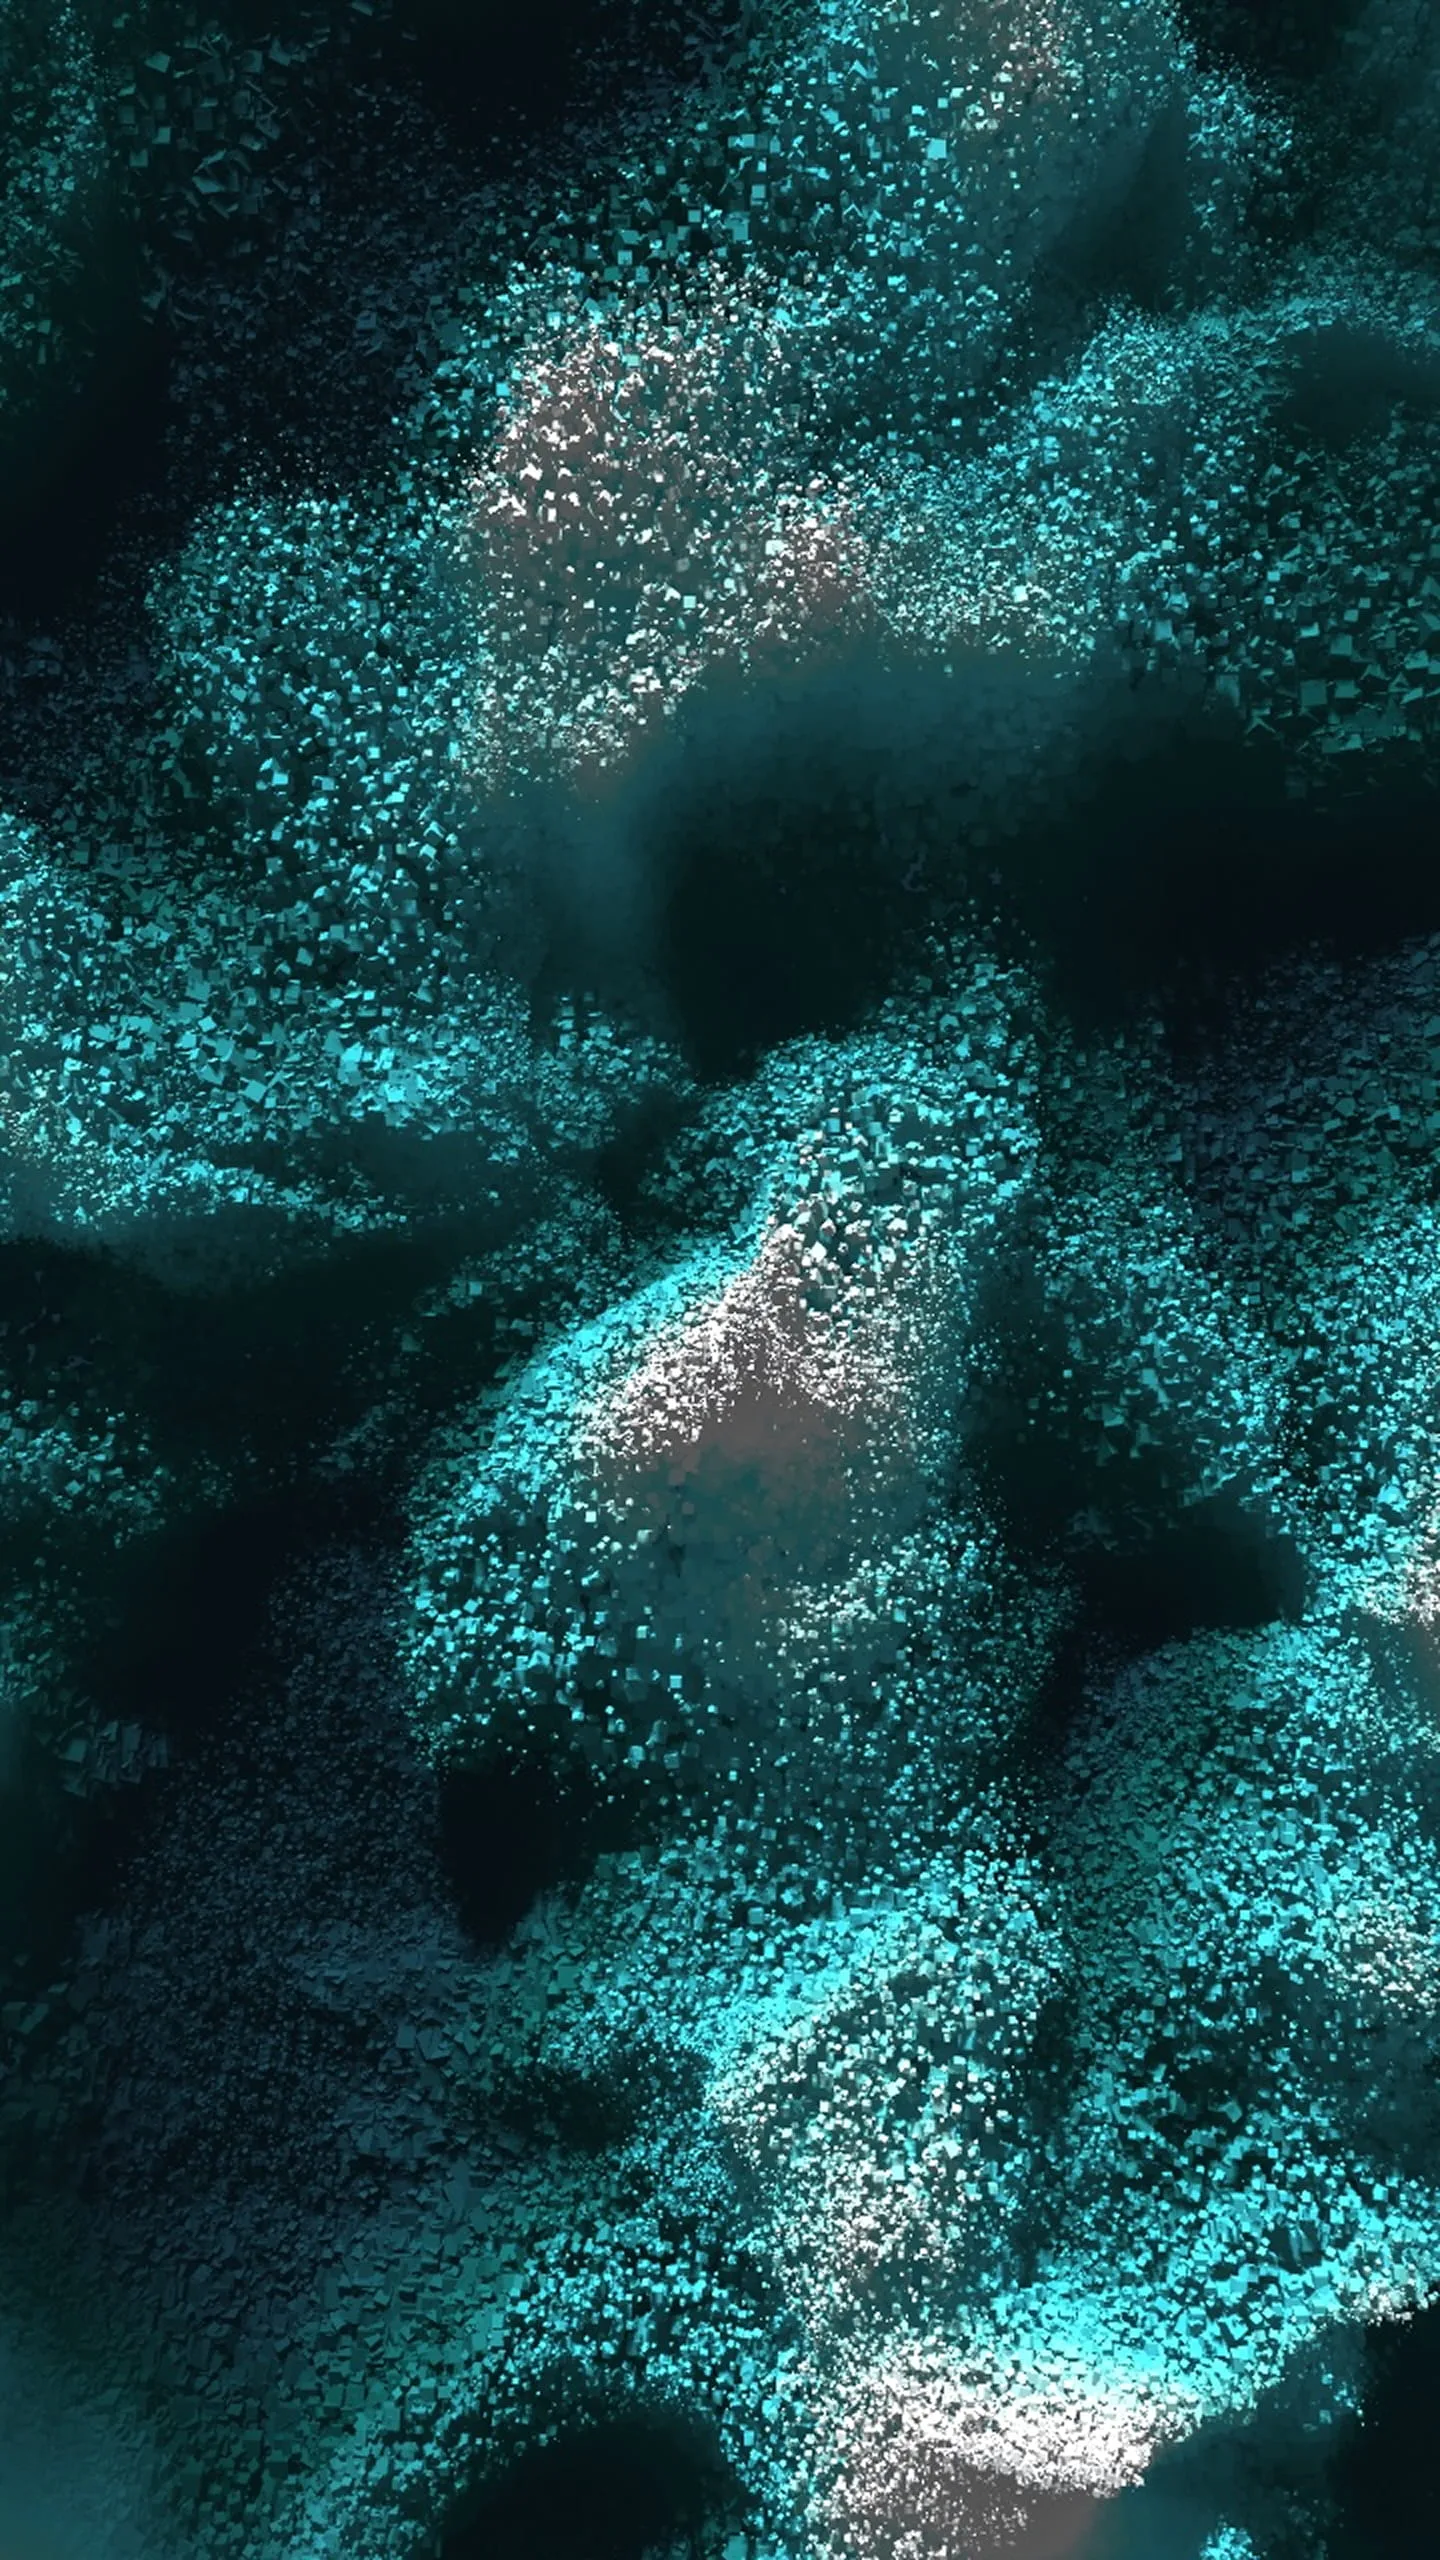
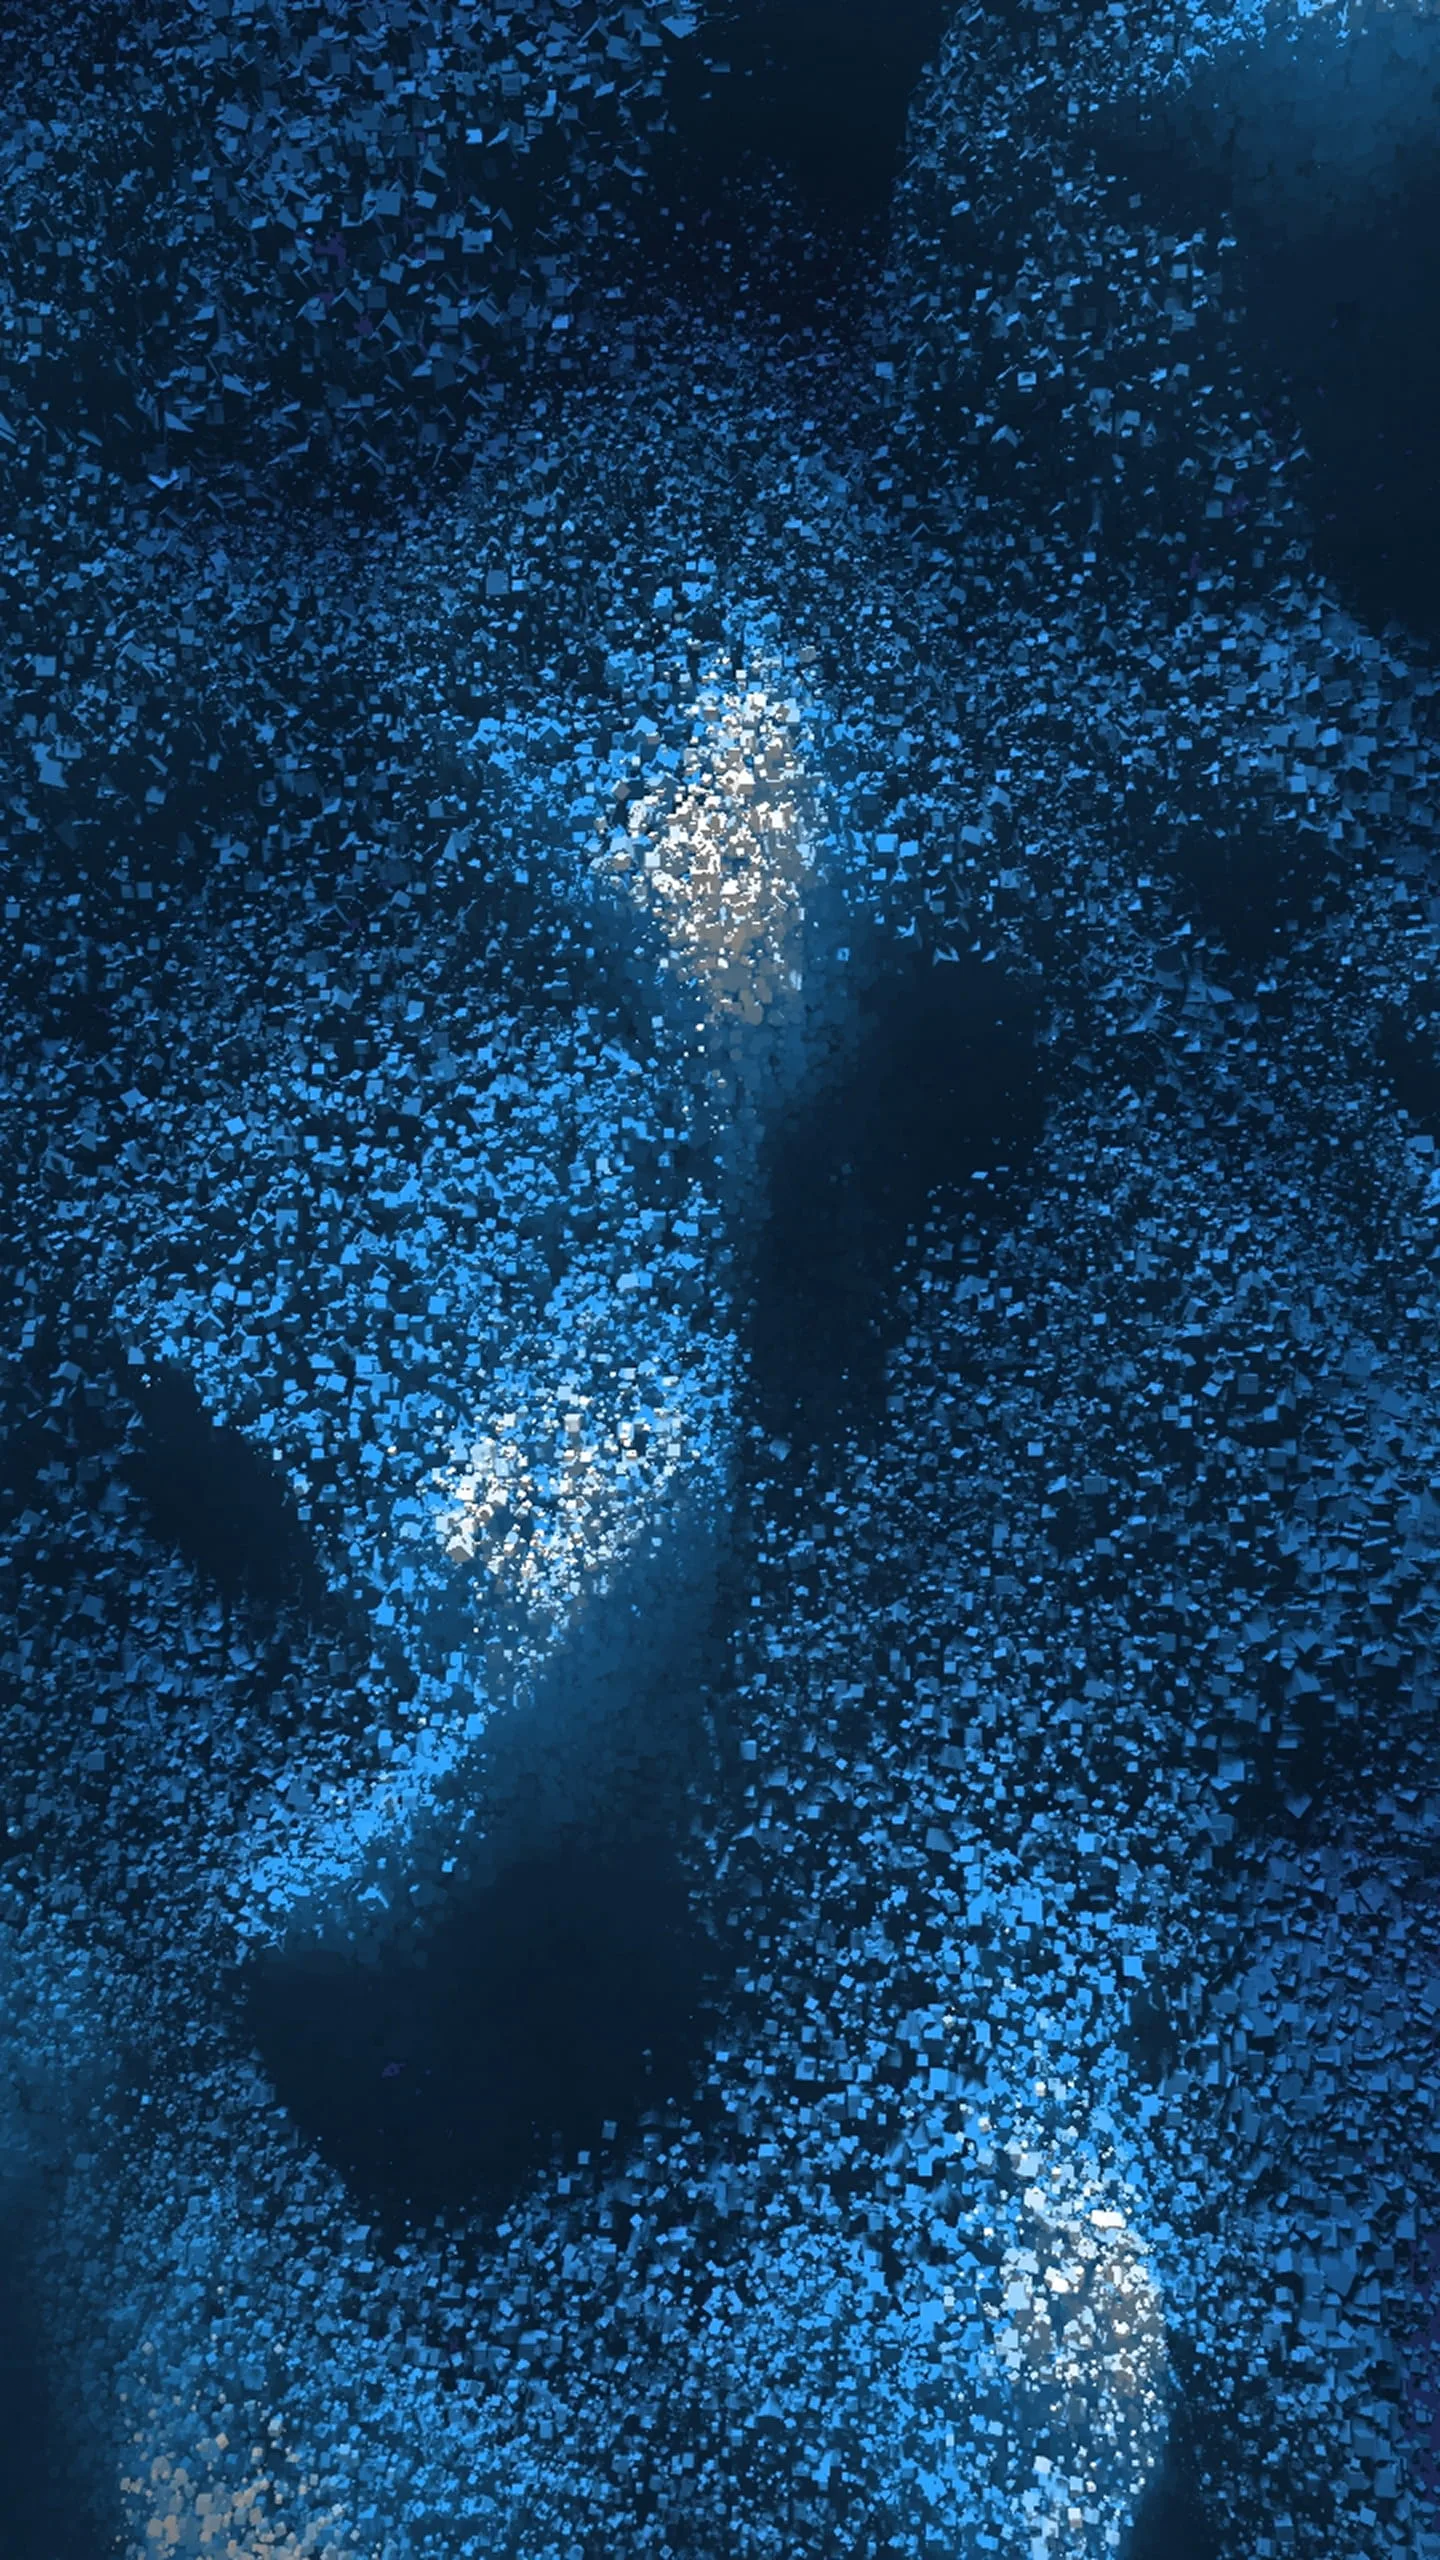
I use data collected from a buoy in the Öresund to control a digital particle system mimicking waves. Water temperature is mapped to particle hue, while sea level shifts the visuals closer to or father from the viewer. Longer wave periods produce smoother movement, while shorter periods result in increased turbulence. Wave height is mapped to the amplitude, creating greater depth during intense wave activity. Wave direction affects the positioning of particles, imparting a sense of directional flow.
Work 2 — Society
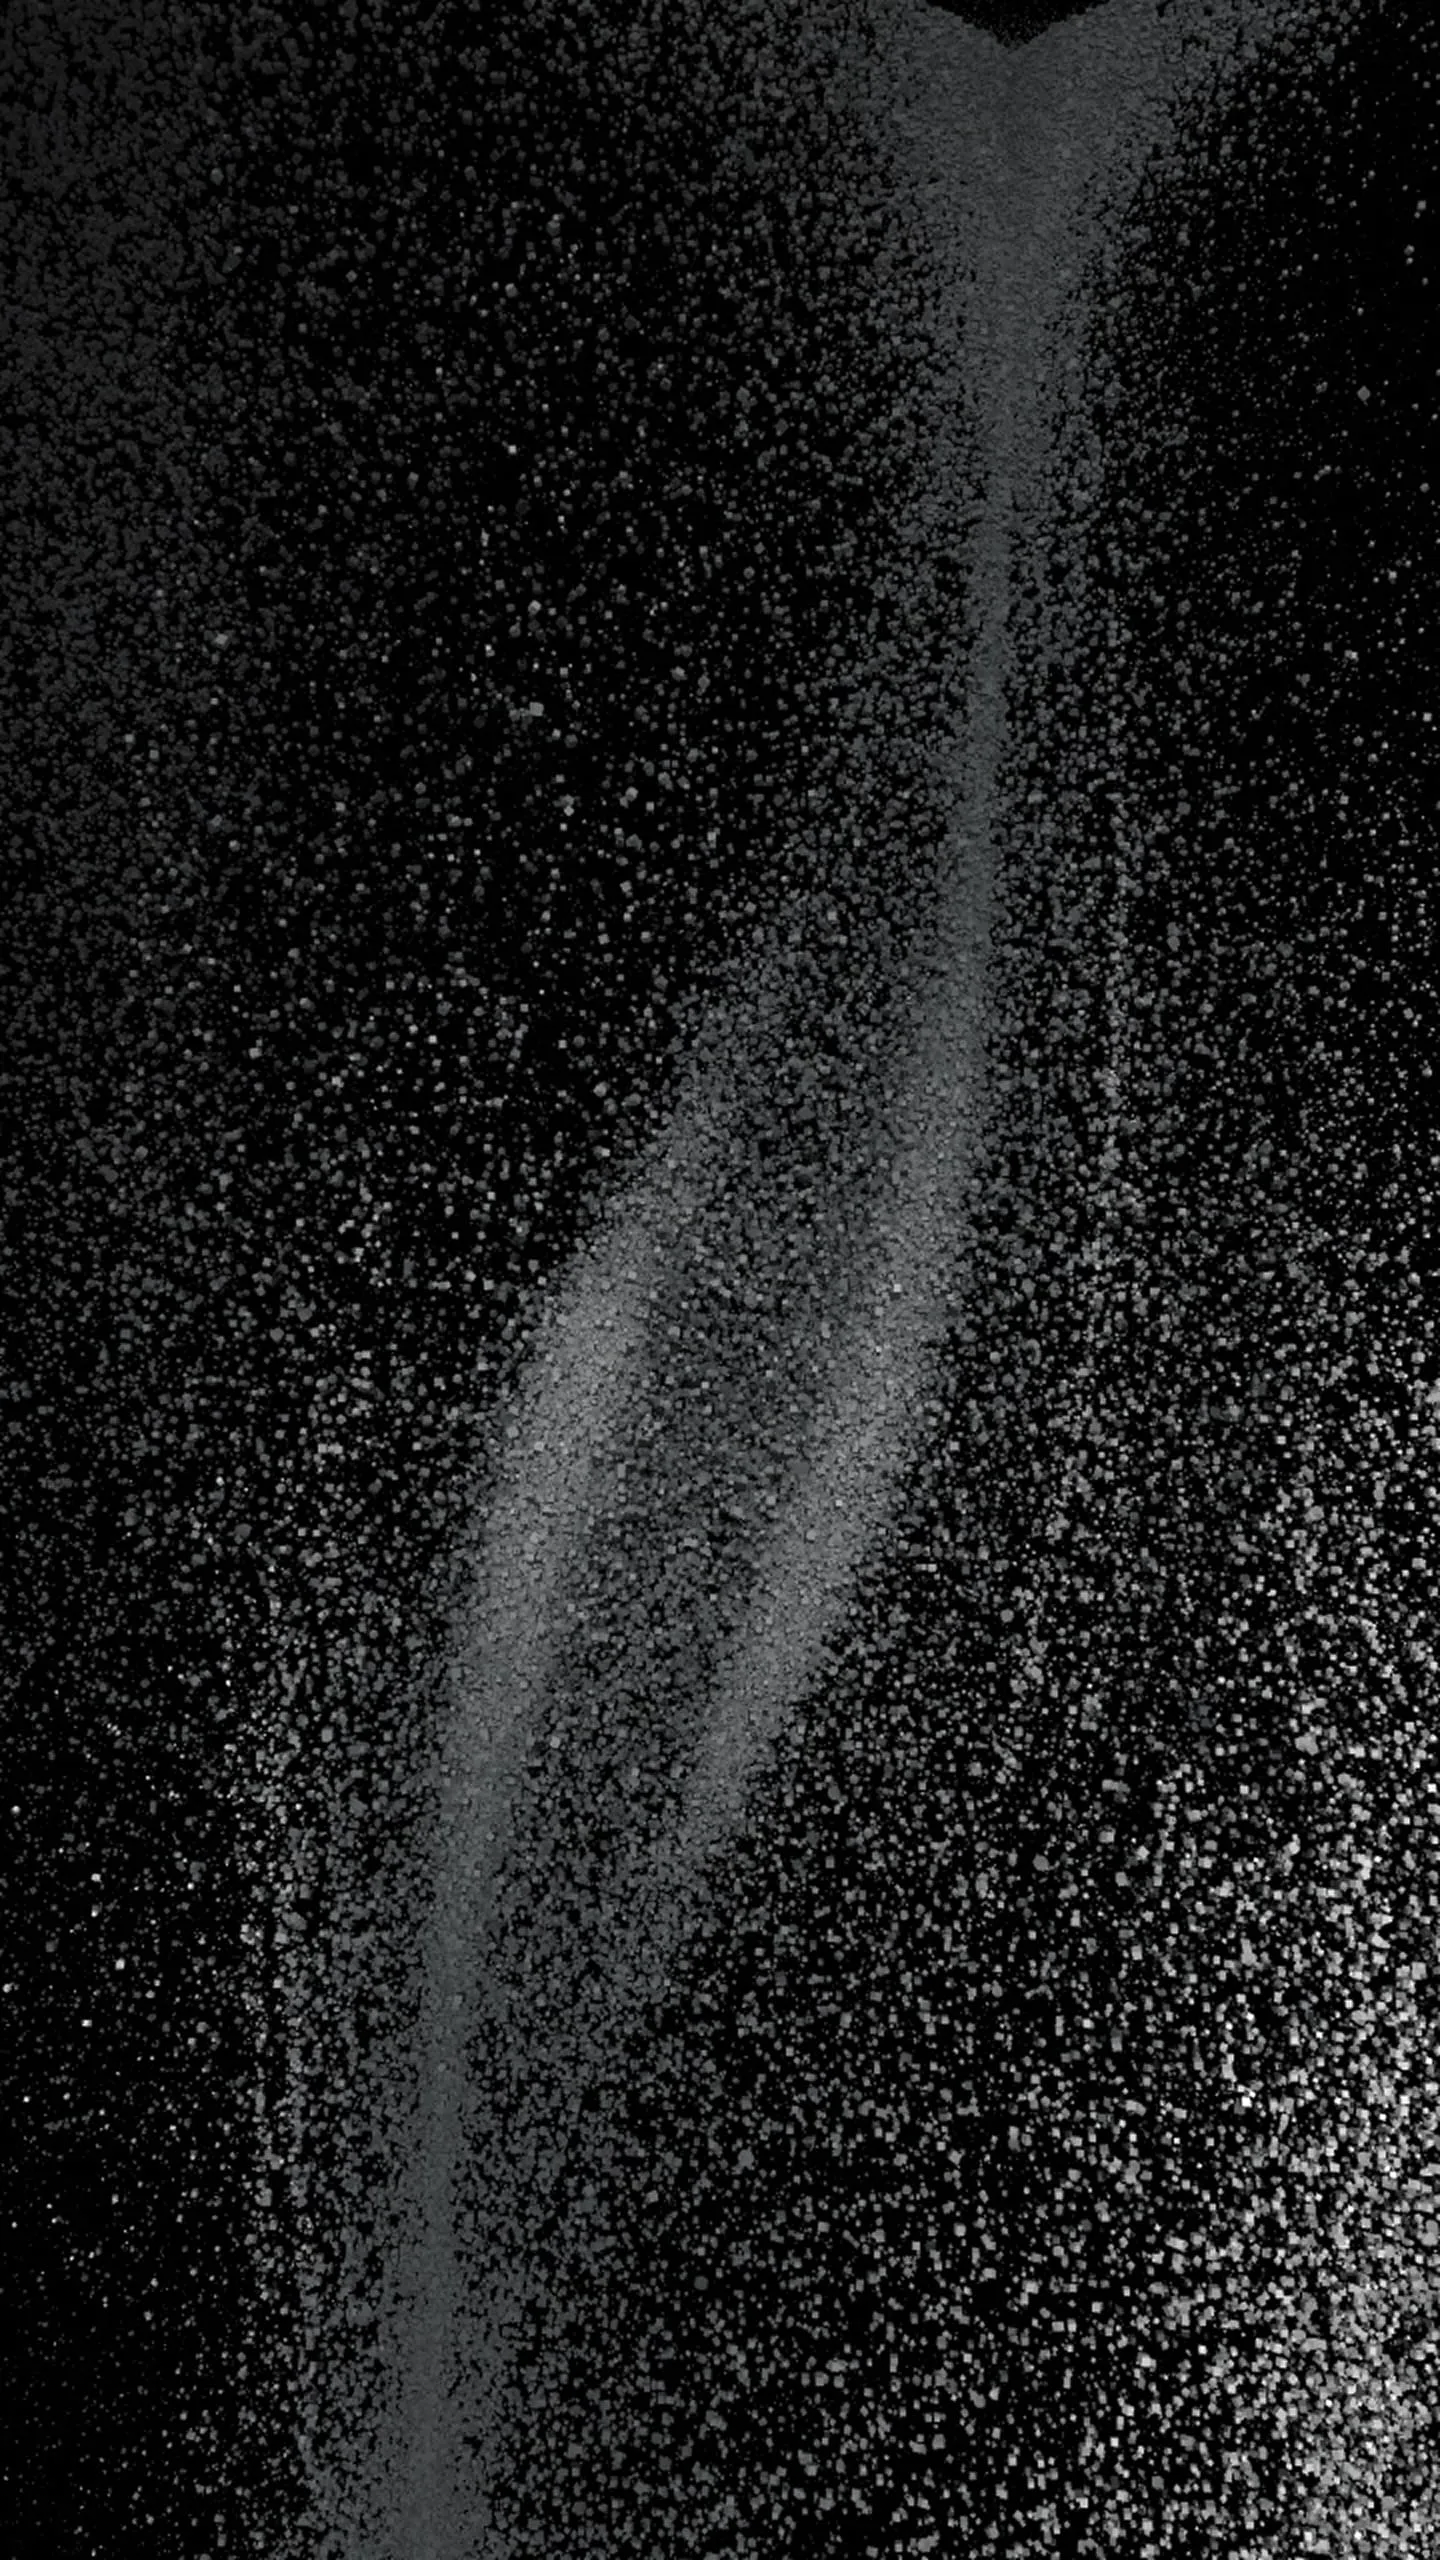
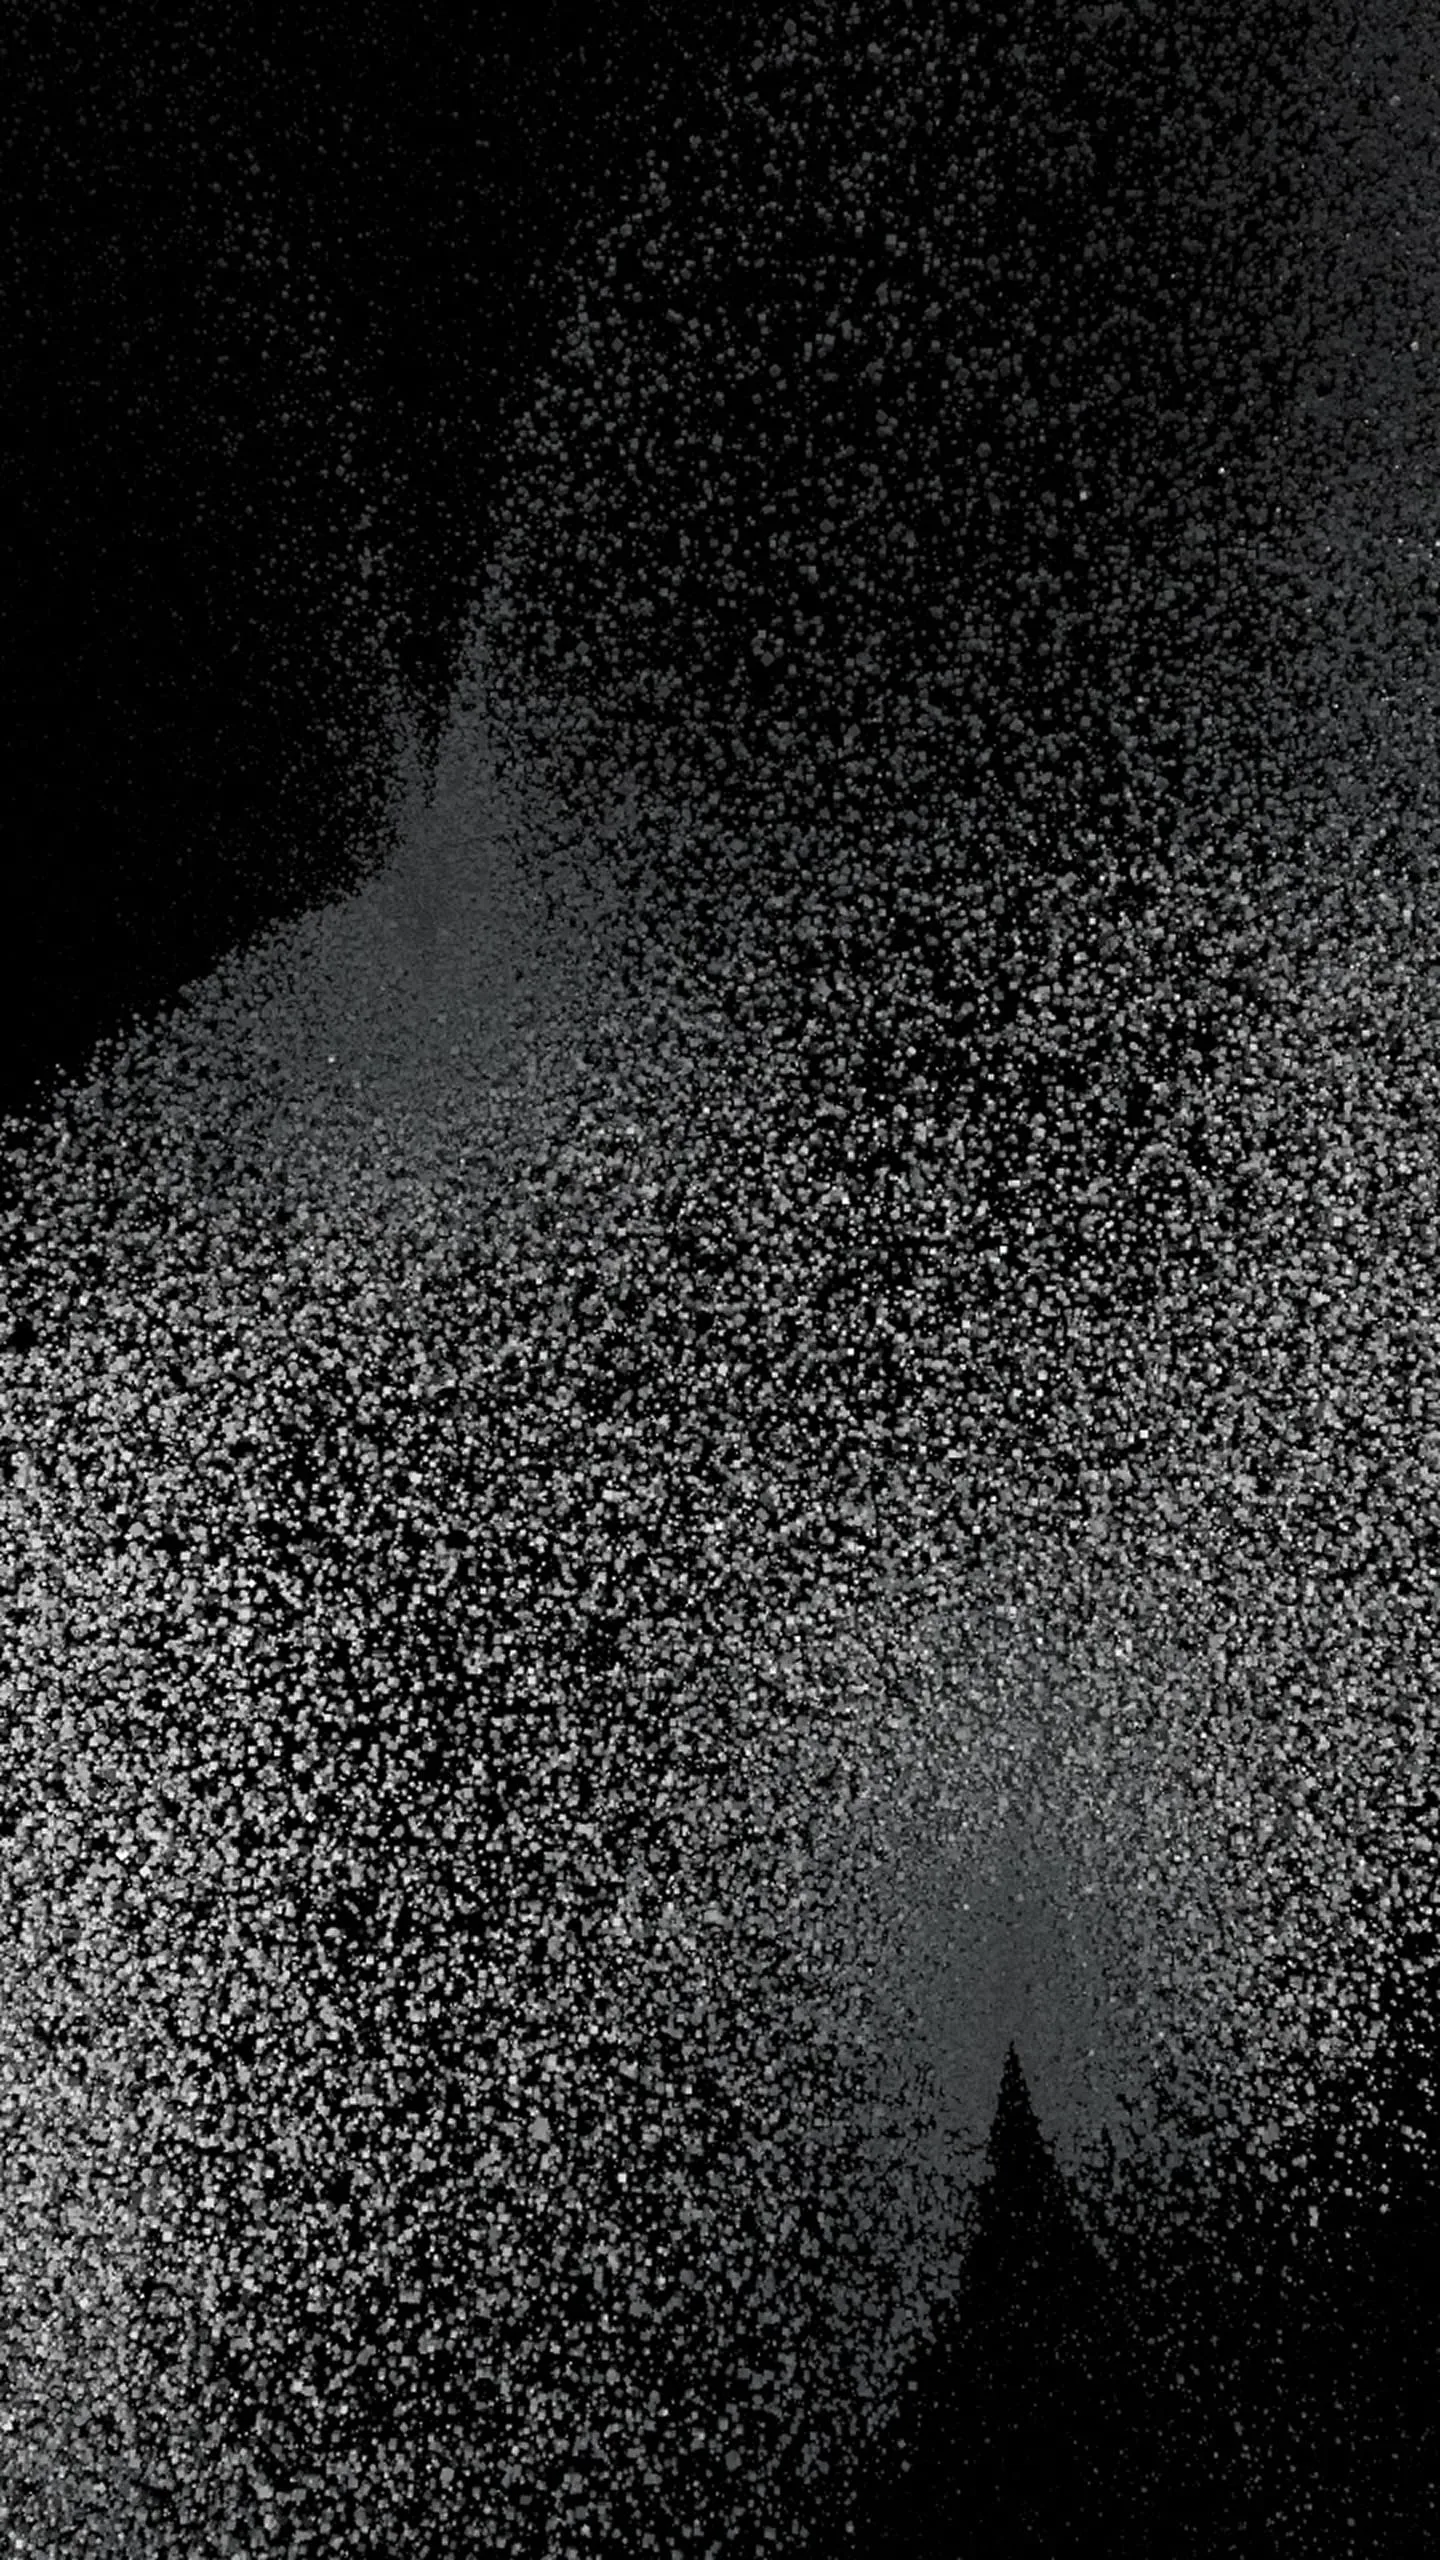
Symbolizing the bidirectional flow between Denmark and Sweden, two oscillating attractor forces move toward one another. The forces leave behind ripples, resembling those of the ferry connections replaced by the Öresund Link. The radius of each attractor is modulated by commuter volume at a given moment in the respective direction of travel. A grey, concrete-like palette emphasizes the human-made infrastructure underpinning this movement.
Work 3 — Wind
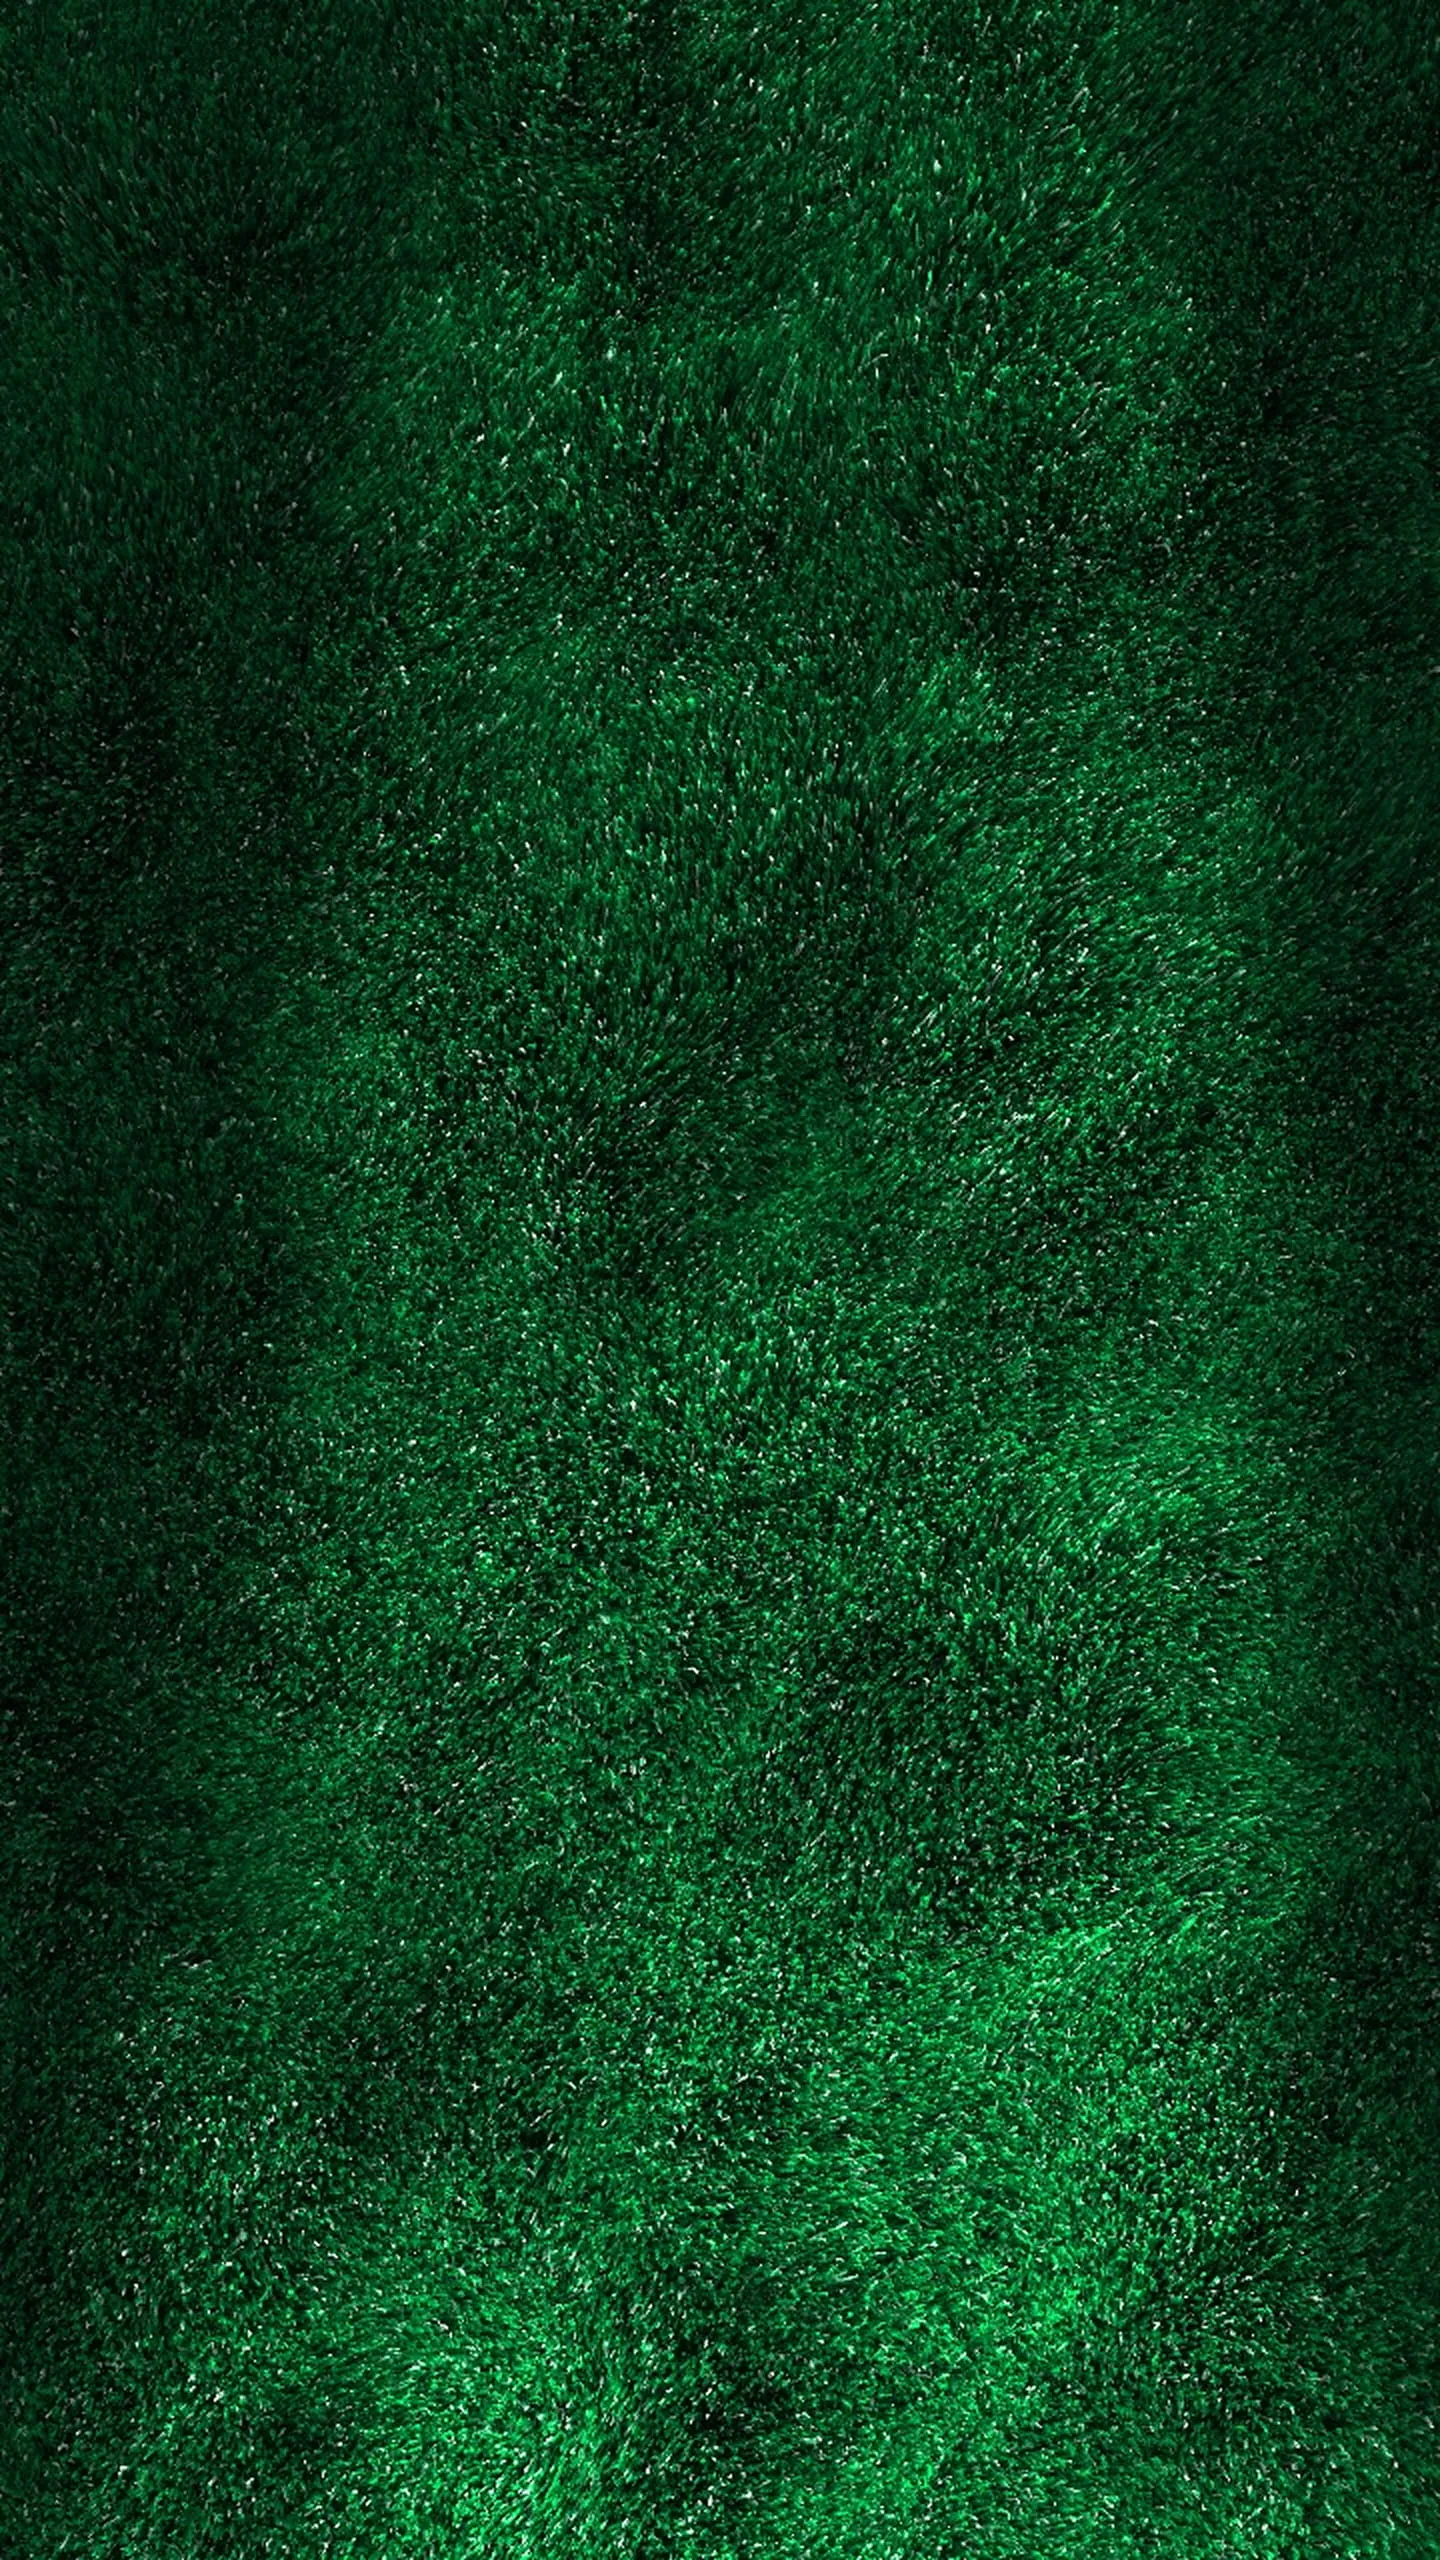
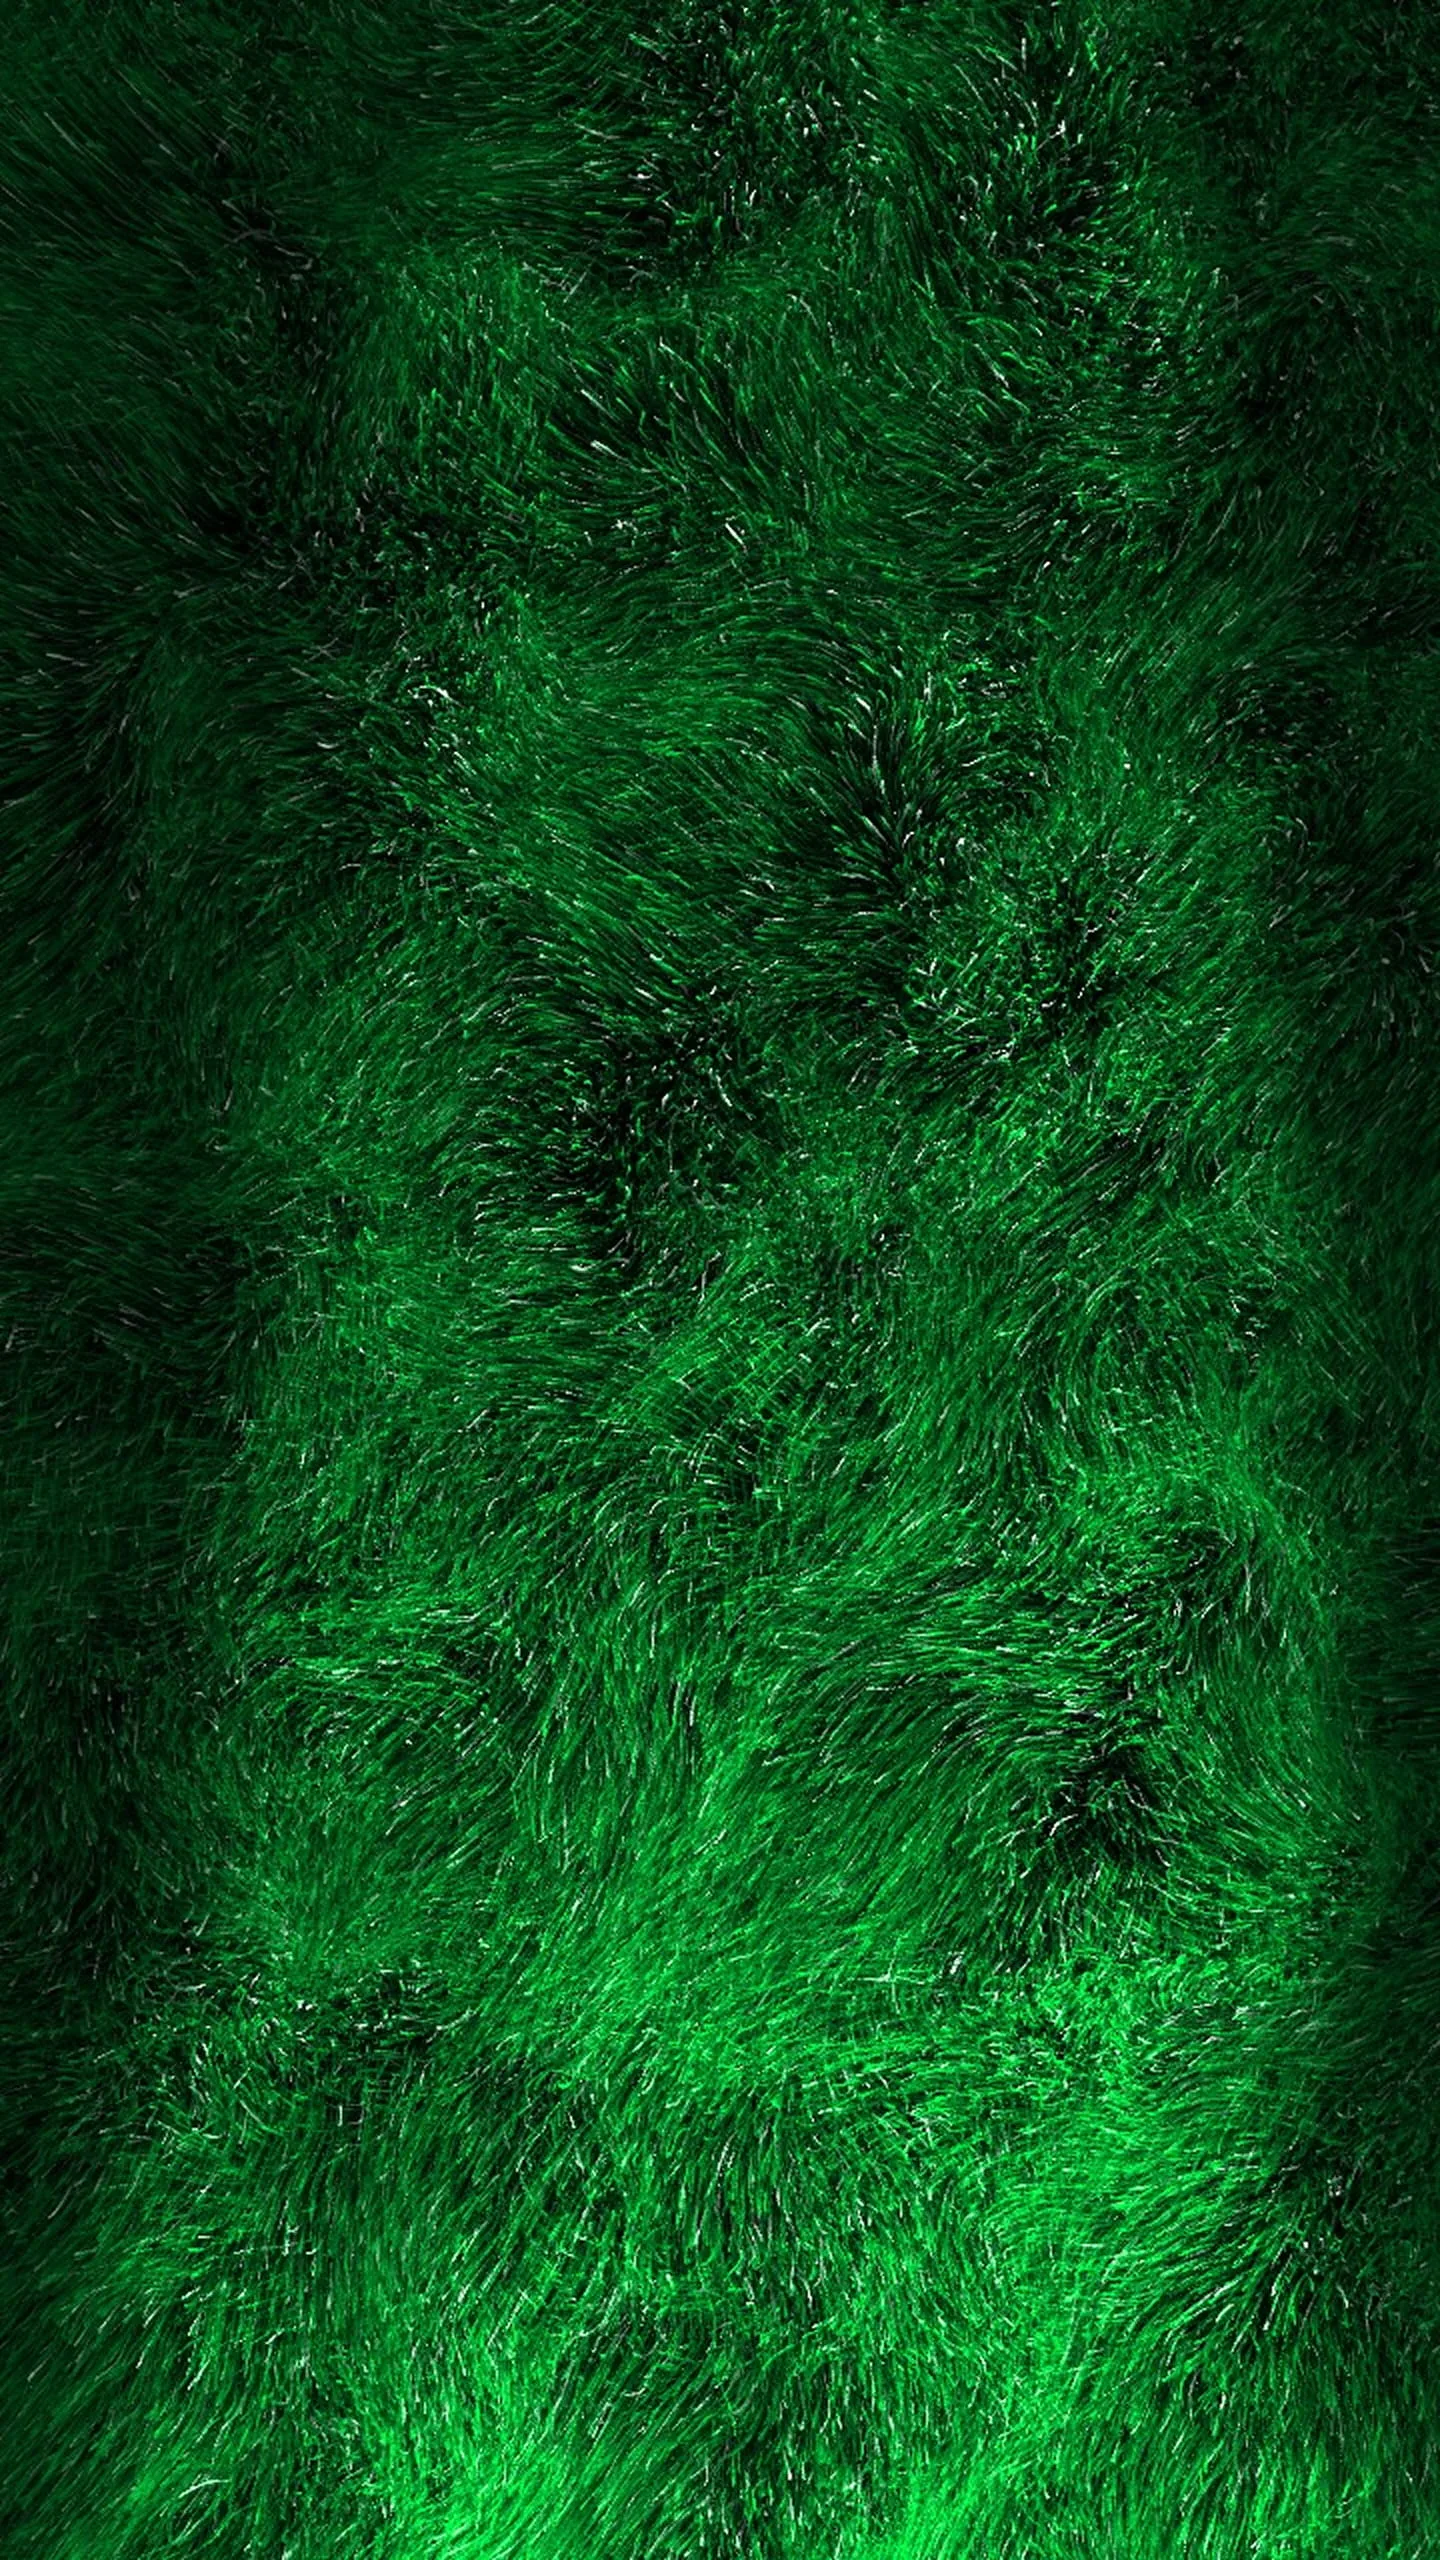
Wind data collected from the highest point of the Öresund Bridge is represented as virtual grass swaying in the wind. Air temperature affects the hue, giving the grass a naturalistic, seasonal quality. Lower air pressure, often linked to stormy weather conditions, produces more chaotic motion. Wind speed and direction affect the movement of the grass and produce more pronounced bends during stronger gusts.
Due to limited access to data collected directly on the Öresund Link, the concept was created using proxy data from nearby locations along the Swedish coastline. Through this project, I explored how abstract data can be transformed into dynamic digital artworks and how these systems can give rise to intuitive visual typologies. The underlying system built in TouchDesigner is highly adaptable and invites further exploration of other themes and dynamics. I plan to expand the system by incorporating data sonification and enabling live data feeds. The project is accompanied by a booklet documenting its development and outcomes, produced as the thesis for a Master's degree in Creative Computing.